Animation
The Graph Editor
The Graph Editor draws a property’s animation as a curve: its value over time, or its speed. It shows exactly how a move eases, and lets you shape it by dragging.
Open the Graph Editor
Select the property. In the Timeline, select an animated property such as Position.
Switch to the graph. Select Show Graph Editor in the Timeline toolbar. The tracks give way to the graph of the selected property; the same button, now Show Timeline, brings them back.
Choose a graph. Value shows the value over time, Speed how fast it changes. The coloured names beside them say which line is which.
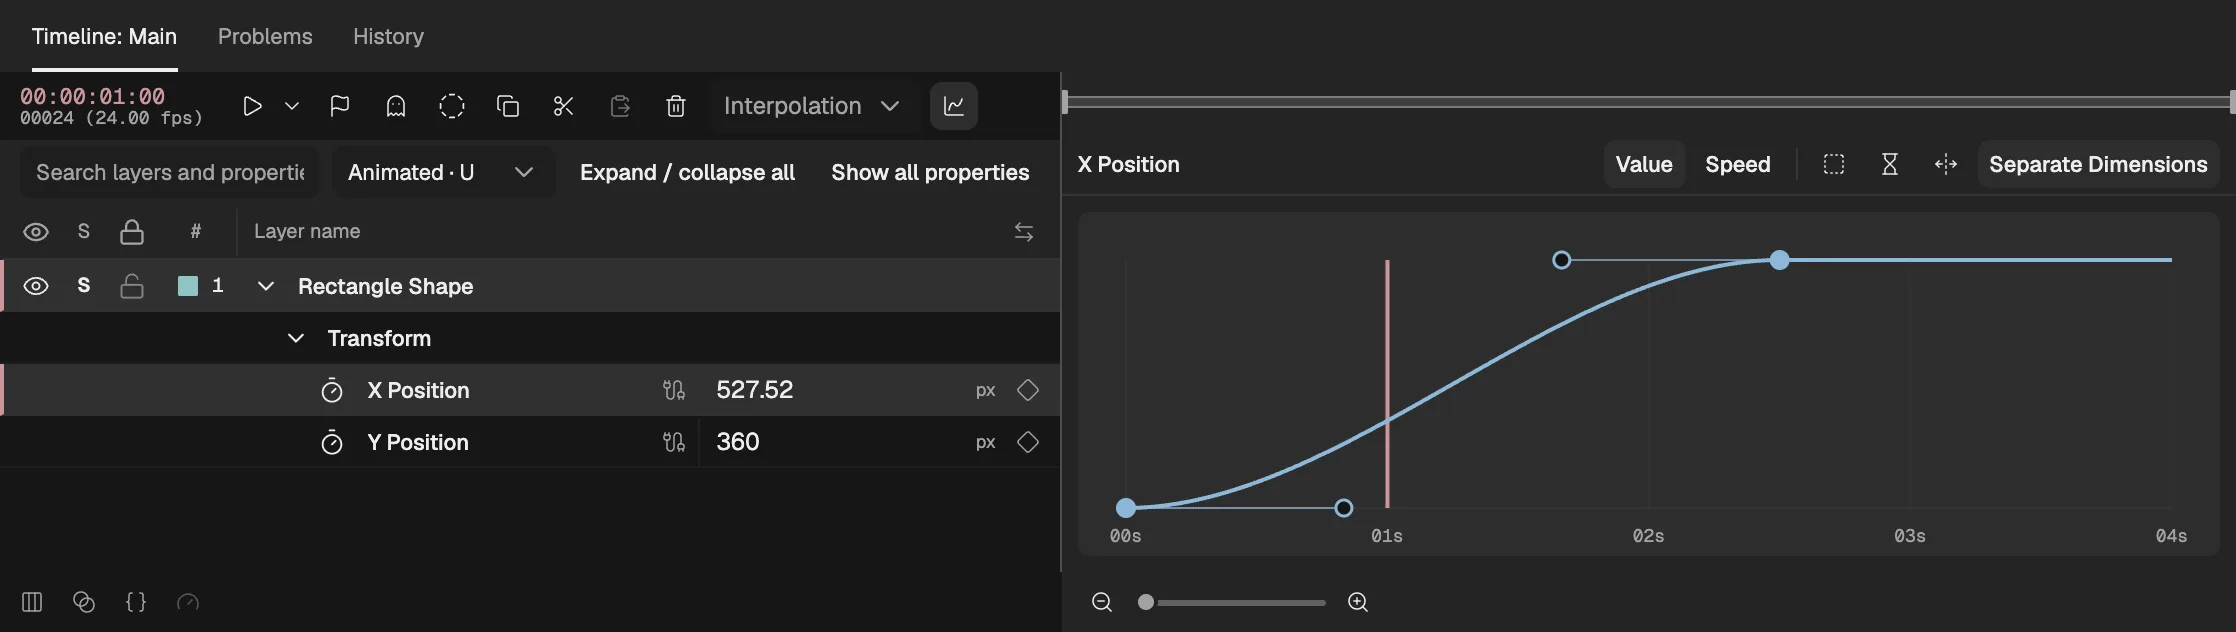
- Switches between the tracks and the graph.
- The value graph.
- The speed graph.
- Splits Position into one property per dimension.
- A keyframe: drag it to change its time or value.
- An ease handle: drag it to change the speed and influence.
Only properties that are numbers, or sets of numbers like Scale, have a graph. When an expression drives the property, the graph shows the keyframed curve underneath it.
Value and speed graphs
In the value graph, a property with several numbers has a line for each: X and Y, and Z in 3D. A flat stretch is a pause and a steep one a fast change; an S-shaped curve between two keyframes is a move that eases in and out.
In the speed graph, a single number and Position each have one line; for Position it is the speed along the motion path. Other properties with several numbers have a line per dimension, which dips below zero while the value falls. An eased move is a hill: it starts at 0, rises, and comes back down to 0.
Position eases along its path rather than in X and Y separately, so its handles are in the speed graph. To shape X and Y on their own, separate its dimensions (below).
Edit the curve
Each edit is one step that ⌘Z undoes. F9 and the other keys from Ease in and out (opens in a new tab) work here as they do on the tracks.
- Drag a keyframe. Sideways moves it in time. Up and down changes its value in the value graph; in the speed graph, it sets the speed through the keyframe on both sides.
- Drag a handle. Selected keyframes show a handle on each Bezier side. How far it reaches sideways is the influence; its height is the speed. On a continuous keyframe, both sides keep one speed.
- Use the keyboard. Keyframes and handles can be reached with Tab and nudged with the arrow keys.
- Work on several. The graph’s toolbar has Select all keyframes, Ease selected keyframes (the same as Easy Ease) and Retime keyframes. In the last, Shift frames moves the selected keyframes by that many frames and Time scale stretches or squeezes their timing from the first of them, when you select Retime selected keyframes.
Separate dimensions
Position normally moves X and Y (and Z) together, with one set of keyframes and one ease. Separate Dimensions splits it into one property per dimension, each with its own keyframes, curve and handles: a layer can then glide sideways at an even speed while it bounces up and down.
The button is in the graph’s toolbar while Position, or one of its dimensions, is selected. Select it again to join the dimensions back into one Position.